Digital mapping of soil organic carbon content in the Kuznetsk-Salair geomorphological province using the Google Earth Engine platform
DOI:
https://doi.org/10.31251/pos.v8i3.335Keywords:
digital mapping; organic carbon content; soils; WorldClim; West Siberia; WorldClim; FABDEM; SoilGrids; Landsat 5; SAGA GIS.Abstract
Abstract. The aim of this study was to create digital maps of soil organic carbon (SOC) content in the 0–30 cm layer using 11 different predictor datasets and the Random Forest algorithm implemented on the Google Earth Engine platform.
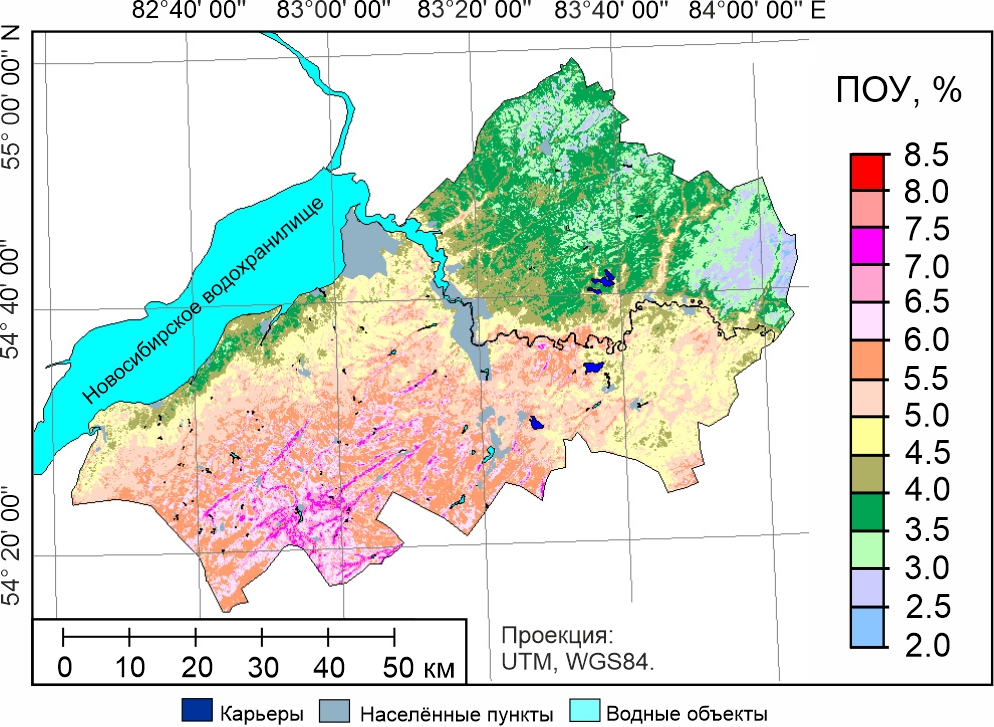
Location and time of the study. The study was carried out in the Kuznetsk-Salair geomorphological province, within the Iskitimsky district in the Novosibirsk Region.
Methods. Digital mapping was performed using the Random Forest (RF) algorithm with settings of 200 and 1000 "trees". RF algorithm is implemented on the Google Earth Engine online platform in the form of a script (code). SOC content was mapped using raster predictor maps that characterized the following soil-forming factors: climate, relief, vegetation, spatial position, and soil properties. The number of predictors used in the modeling varied depending on the number of available indicators and the correlation coefficient (R) between the SOC content and the predictor values. The following numbers of predictors were used: 80 (all); 2) 50 (all with R>±0,1); 3) 42 (all with R>±0,2); 4) 26 (all with R>±0,3); 5) 15 (all with R>±0,4). Additionally, the SOC content was mapped using five sets of predictors characterizing individual soil formation factors (relief, climate, vegetation, soil, spatial position), and one dataset combining five dominant predictors from each soil formation factor. Thus, a total of 11 sets of predictors was used, the sets presented both in various combinations of indicators of soil formation factors and individually. Training (TD, n=206) and validation (VD, n=55) data sets were used in the study. The database was created using archival materials from the "Zapsibgiprozem" Land Management Institute from 1984 to 1994. It contains data on the SOC content in the 0–30 cm layer, with a sample size of 261.
Results. The optimal model for mapping SOC content in the 0–30 cm layer, based on 42 predictors and 200 trees, demonstrated the highest accuracy. The simulation performance indicators are as follows: R2TD=0,83, R²VD=0,55; RMSEVD=1,25%. Model performance indicators showed that the model performed well. According to the actual data, the SOC content ranged from 1,2 to 13,9%. The generated map showed that the highest SOC levels were found in the southwestern part of the study area.
Conclusions. The use of raster maps of predictors with low original resolution (1×1 km – WorldClim, 250×250 m – SoilGrids) improved to 30×30 m, combined with medium-resolution predictor maps (topography, vegetation, spatial location), allows for better results in digital mapping of SOC. Some groups of predictors (climate, soil, spatial location) provide a global trend in the variation of SOC content in the final map, while others (topography, vegetation) display differentiating/detailing trends that take into account the characteristics of the terrain and vegetation. Thus, predictors characterizing different soil formation factors complement each other in the combined predictor dataset and enable development of more detailed maps during SOC mapping.
Downloads
Downloads
Published
How to Cite
Issue
Section
License
Copyright (c) 2025 The Journal of Soils and Environment

This work is licensed under a Creative Commons Attribution 4.0 International License.